By Persona — Operations & Logistics
Fix Inefficiencies Before They Cost You.
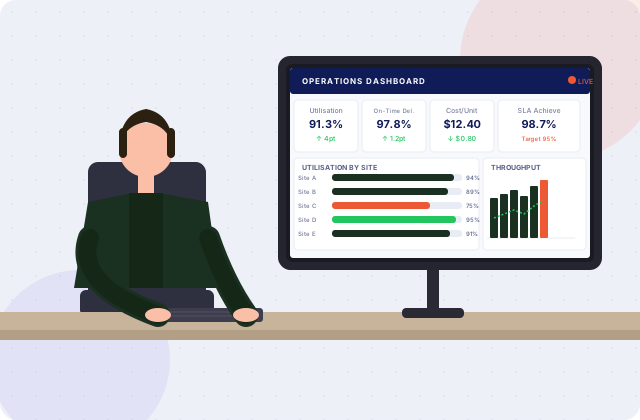
Real-time visibility into utilisation, throughput, delivery performance, and operational KPIs — so you manage proactively, not reactively.
The Problem
The Operations Visibility Problem
Operations leaders carry more complexity than any other function — and typically have the least visibility. By the time a problem surfaces in a report, it's already a crisis.
01
Problems Discovered After the Damage Is Done
Delivery delays, utilisation drops, cost over-runs — surfaced in the weekly report, after the fact. Real-time data would have allowed an intervention that retrospective reporting can't.
02
Operational Data Scattered Across Systems
Fleet management in one system. Warehouse in another. Scheduling in a spreadsheet. You can't see the whole operation in one view — so bottlenecks hide in the gaps between systems.
03
Capacity Decisions Without Demand Signals
Hiring, asset investment, and capacity planning made without a real-time view of utilisation trends. The result: over-capacity in slow periods, bottlenecks in peak ones.
What You Get
What Firehawk Gives an Operations Leader
A unified operational view — so you can manage capacity, throughput, and cost in real time, not retrospect.
Utilisation by team, asset, and site — daily
See utilisation at every level of your operation. Identify underutilised resources before they become a cost problem or demand a reactive conversation with the CFO.
Throughput and delivery performance
On-time delivery rate, throughput by stage, and bottleneck identification — tracked daily, not weekly.
Operational cost vs budget in real time
Labour, fleet, facilities, and variable costs tracked against plan. Catch over-runs in the week they happen, not at month-end.
Demand vs capacity alignment
Connect your order pipeline or booking volume to your capacity plan. See whether you're heading into a constraint weeks before it arrives.
Incident and exception tracking
Operational exceptions — delays, defects, shortfalls — captured and tracked. Pattern recognition before a one-off becomes a systemic issue.
Cross-site benchmarking
If you run multiple sites, compare throughput, utilisation, cost per unit, and quality metrics side by side. Identify best practice and close the gap.
Your Metrics
The KPIs That Run an Operation
From utilisation to on-time delivery to cost per unit — the operational metrics that separate efficient operations from expensive ones.
ThroughputUtilisationCostQuality
01Utilisation
Resource Utilisation Rate
Percentage of available capacity (people, assets, or facilities) in productive use. The master efficiency metric for any operations function.
02Quality
On-Time Delivery Rate
Percentage of orders or commitments fulfilled on schedule. Benchmark: 95%+ for competitive operations.
03Throughput
Throughput per Hour / Day
Units produced, orders processed, or work completed per time period. Tracks productivity and identifies bottlenecks before they compound.
04Cost
Labour Cost per Unit
Direct labour cost divided by output. The unit economics metric that connects people cost to productive output.
05Utilisation
Capacity vs Demand Gap
Difference between current capacity and forecasted demand. The forward-looking metric that drives hiring and asset investment decisions.
06Quality
Defect / Error Rate
Percentage of outputs requiring rework, correction, or rejection. Quality cost driver — every defect costs 3–5x the original production cost to fix.
07Cost
Operational Cost vs Budget
Actual operating costs against plan at the category level. Identifies which cost lines are running hot before they blow the monthly P&L.
08Quality
SLA Achievement Rate
Percentage of service level commitments met. For service operations — the metric that determines client satisfaction, contract compliance, and renewal risk.
09Utilisation
Fleet / Asset Utilisation (if applicable)
Productive hours per asset relative to available hours. Idle assets are expensive — tracking utilisation justifies or challenges capital investment decisions.
What Others in Your Role Say
Trusted by decision-makers who demand real numbers.
These aren't proof-of-concept pilots. They're operators like you who switched from spreadsheets and other tools to Firehawk — and didn't look back.
48hr
to first dashboard
500+
pre-built KPIs
100%
IP owned by you
“We run logistics across seven depots and had no single view of utilisation across the network. Firehawk gave us a daily utilisation dashboard that showed us two underperforming depots we'd been subsidising with the profitable ones. We restructured within a quarter.”
N.W.
COO, National Logistics Group, NSW
The Process
Operational Visibility in 48 Hours
We connect your operational systems, scheduling tools, and accounting data to deliver a live operations dashboard in 48 hours.
01
Day 0
Map
We understand your operational systems, data sources, and the KPIs that matter most to your function.
02
Day 0–1
Connect
Connect your ERP, scheduling, fleet, CRM, and accounting systems. Automated daily sync.
03
Day 1
Configure
Utilisation dashboard, throughput tracking, cost vs budget, and capacity vs demand — built for your operation.
04
Day 2
Live
Operations team is live. Manage proactively, not reactively. You own the IP.
FAQ
Questions answered
Everything you need to know before booking your Blueprint session.
Still unsure?
Talk to the team
Book a 30-minute call and we’ll answer any questions specific to your business.
Yes. Firehawk connects to most ERP systems, warehouse management platforms, fleet management software, and scheduling tools. For proprietary or legacy operational systems, custom integrations are available on the Pro and Custom plans.
Ready to see what your data can do?
◆ Infrastructure Studio
Scoped to your business