By Persona — Investors & PE
Due Diligence in Days, Not Months.
Portfolio-level visibility. Deal-ready data rooms. Performance that doesn't require a site visit to understand.
The Problem
The Portfolio Visibility Problem
Private equity and investor operations are built on data. But most portfolio companies still run on spreadsheets — which means your data is always weeks behind, always manually compiled, and always at risk of interpretation.
01
Portfolio Performance Reported, Not Monitored
Monthly management reports from each portfolio company arrive weeks after month-end, prepared by management. You have no independent view of what's actually happening between reporting cycles.
02
Due Diligence That Takes Months
Data rooms built by management. Financial models validated from inconsistent source data. Quality of Earnings processes that cost six figures and take three months. There's a better way.
03
Value Creation Without a Baseline
You know where you want to take the business. You don't have the operational data foundation to measure whether your value creation initiatives are actually working.
What You Get
What Firehawk Gives Investors & PE
Independent, live visibility across your portfolio — from initial due diligence through to exit.
Portfolio-level KPI consolidation
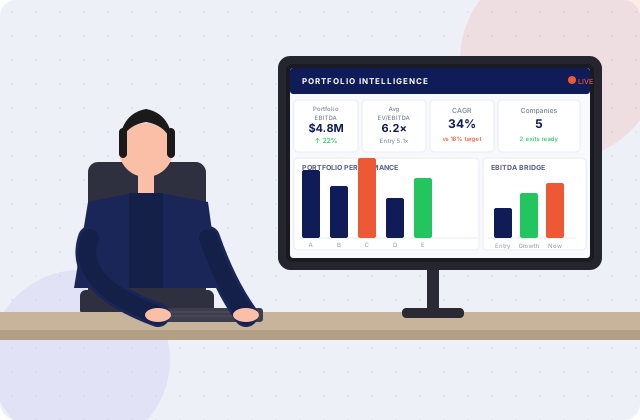
All portfolio companies in one dashboard. Revenue, EBITDA, cash position, and growth rate across every investment — updated daily.
Independent verification of management reports
Management reports verified against live data before they reach you. No more waiting to find out if the numbers are real.
Due diligence data rooms in 48 hours
Deploy Firehawk on a target company and generate a data room — financial history, operational KPIs, and trend analysis — in two days instead of two months.
Value creation initiative tracking
KPIs tied directly to your 100-day plan and value creation strategy. Measure whether initiatives are moving the numbers — not just whether they've been executed.
Exit readiness dashboards
Revenue quality, EBITDA normalisation, and management team performance — the metrics an acquirer will ask for, prepared before they ask.
Benchmarking across portfolio
Compare margins, growth rates, and operational efficiency across all portfolio companies. Identify which operators are performing and which need intervention.
Your Metrics
The KPIs That Drive Investment Performance
From EBITDA bridge to revenue quality to management team productivity — the metrics that matter from acquisition to exit.
FinancialGrowthValuationOperations
01Financial
EBITDA (Normalised)
EBITDA with one-off and non-recurring items identified and excluded. The metric acquirers and lenders use — should be calculated from day one, not at exit.
02Valuation
Revenue Quality Score
Recurring vs one-off revenue split. High recurring revenue quality commands valuation premium. Track it from acquisition.
03Growth
Revenue Growth Rate (CAGR)
Compound annual growth rate over your ownership period. The primary equity value creation metric.
04Financial
Gross Margin Expansion
Gross margin improvement since acquisition. Direct indicator of operational leverage and pricing power improvement.
05Operations
Working Capital Efficiency
Cash conversion cycle — DSO, DPO, and inventory days. Working capital optimisation is often the fastest path to EBITDA improvement.
06Operations
Management Team Productivity
Revenue per employee and EBITDA per employee. Tracks whether management is building leverage into the business model.
07Valuation
Customer Concentration
Revenue share from top 3 customers. High concentration is a valuation discount — tracking and reducing it is a value creation lever.
08Valuation
Enterprise Value / EBITDA Trend
Implied valuation at current EBITDA run-rate versus entry multiple. Tracks the equity value creation journey in real time.
What Others in Your Role Say
Trusted by decision-makers who demand real numbers.
These aren't proof-of-concept pilots. They're operators like you who switched from spreadsheets and other tools to Firehawk — and didn't look back.
48hr
to first dashboard
500+
pre-built KPIs
100%
IP owned by you
“We deployed Firehawk across our five portfolio companies within a month. For the first time we had a portfolio-level view — revenue, EBITDA, and cash — without waiting for management reports. It changed how we run our monthly portfolio review entirely.”
G.R.
Managing Partner, Private Equity Fund
The Process
Portfolio Visibility in 48 Hours
We deploy Firehawk on your portfolio company, connect the data sources, and deliver independent financial and operational visibility in 48 hours.
01
Day 0
Scope
Understand the company's systems, data sources, and the investment thesis KPIs we need to track.
02
Day 0–1
Connect
Connect accounting, CRM, and operational systems. Automated data validation against management reports.
03
Day 1
Configure
Portfolio-level dashboard built. EBITDA bridge, revenue quality, and management team performance views configured.
04
Day 2
Live
Independent portfolio visibility live. Management reports verified. Value creation tracked from day two.
FAQ
Questions answered
Everything you need to know before booking your Blueprint session.
Still unsure?
Talk to the team
Book a 30-minute call and we’ll answer any questions specific to your business.
Yes. PE funds and investors with multiple portfolio companies can access all companies in a single Firehawk portal, with per-company drill-down and portfolio-level consolidated views for revenue, EBITDA, and cash.
Ready to see what your data can do?
◆ Infrastructure Studio
Scoped to your business