By Persona — Founders & CEOs
Stop Running on Gut Instinct.
You built the business. Now get the intelligence layer to run it — one source of truth, every morning, for every decision that matters.
The Problem
Three Things Every Founder Knows Too Well
If any of these sound familiar, you're already paying the cost of information debt — in wasted time, delayed decisions, and missed revenue.
01
You're the Last to Know
End-of-month surprises. Revenue numbers that don't match your intuition. Issues you find out about in the board pack, weeks after they could have been fixed.
02
Your Team Runs on Different Numbers
Finance has one P&L. Sales has another. Operations has a spreadsheet nobody else trusts. Every leadership meeting starts with twenty minutes arguing about whose data is right.
03
Strategic Decisions Without a Foundation
Hire or hold? Which division to invest in? Which product is actually profitable? You're making million-dollar calls on gut feel and quarterly summaries that are already three weeks old.
What You Get
The CEO Intelligence Layer
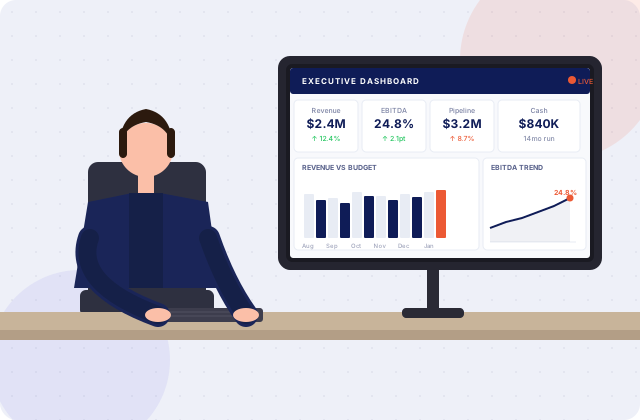
Firehawk gives you one source of truth that connects your operations, finance, and commercial data — so you make every decision from a position of clarity.
P&L to EBITDA — every morning before 7am
Revenue, gross profit, EBITDA, headcount costs, and variance to budget — updated overnight, waiting in your inbox before the day starts.
Every division. One dashboard.
Whether you run one entity or twelve, Firehawk consolidates everything into a group-wide view. Drill down to any business unit in two clicks.
Leading indicators, not lagging reports
Know your revenue trajectory before the month closes. Pipeline, utilisation, booking trends — the forward-looking data that lets you act early.
Board packs that write themselves
Your Firehawk dashboards become your board pack. No more two-day compile jobs every quarter — export what's already live.
One version of truth for your leadership team
Everyone sees the same numbers. No more data disputes. Meetings focus on decisions, not reconciling spreadsheets.
48-hour deployment, zero IT overhead
Live in 48 hours. No IT project, no six-month rollout. We connect, we configure, you get clarity.
Your Metrics
The Metrics a CEO Actually Needs
Not every KPI in the business — just the ones that tell you if the business is healthy, growing, and running efficiently.
FinancialGrowthEfficiencyPeople
01Financial
Revenue vs Budget (MoM)
Actual revenue against plan, every month. Immediately surfaces under- and over-performance before end of quarter.
02Financial
Gross Profit Margin
Revenue minus direct costs as a percentage. Tracks whether your business model is scaling efficiently or margin is compressing.
03Financial
EBITDA
Earnings before interest, tax, depreciation, amortisation. The core valuation and performance metric for owner-operators and boards.
04Growth
Revenue Growth Rate (MoM & YoY)
Month-on-month and year-on-year revenue trajectory. Separates seasonal noise from structural trends.
05Financial
Cash Position & Runway
Current cash balance, burn rate, and months of runway. The metric that determines whether you're operating from confidence or constraint.
06Efficiency
Revenue Per Employee
Total revenue divided by headcount. Tracks organisational efficiency and the leverage each hire delivers.
07Efficiency
Operating Cost Ratio
Total operating costs as a percentage of revenue. Identifies cost creep before it becomes a structural problem.
08Financial
Customer Concentration
Revenue percentage from top 3 clients. High concentration is an unpriced risk — this metric keeps it visible.
09Growth
Pipeline Value & Conversion Rate
Total pipeline and the historical conversion rate that makes it meaningful. Forecasts next-quarter revenue from this quarter's activity.
What Others in Your Role Say
Trusted by decision-makers who demand real numbers.
These aren't proof-of-concept pilots. They're operators like you who switched from spreadsheets and other tools to Firehawk — and didn't look back.
48hr
to first dashboard
500+
pre-built KPIs
100%
IP owned by you
“I was running a $12M business off spreadsheets and end-of-month reports. Firehawk gave me a view of the business I'd never had — P&L by division, every morning, before my first coffee. The first week we identified a cost blowout we'd have missed until month-end.”
B.K.
Founder & CEO, Professional Services Group, NSW
The Process
From First Call to First Dashboard in 48 Hours
No IT project. No six-month rollout. We connect to your existing systems, map your business, and deliver your first CEO dashboard in 48 hours.
01
Day 0
Discovery
We understand your business structure, reporting needs, and the decisions you're trying to make. Takes thirty minutes.
02
Day 0–1
Connect & Audit
We connect your data sources — accounting, CRM, operational systems — and map your P&L and key performance indicators.
03
Day 1
Configure
Dashboards built around how your business is actually structured. CEO view, division view, and operational views — all connected.
04
Day 2
Live
Your intelligence layer is live. One source of truth, every morning, for every decision that matters. You own the IP.
FAQ
Questions answered
Everything you need to know before booking your Blueprint session.
Still unsure?
Talk to the team
Book a 30-minute call and we’ll answer any questions specific to your business.
Firehawk connects to your accounting platform (Xero, MYOB, Sage, NetSuite), CRM, operational systems (ERP, PMS, inventory), and any other data source in your business. Most connections are built-in; custom integrations are available for proprietary systems.
Ready to see what your data can do?
◆ Infrastructure Studio
Scoped to your business