By Persona — Customer Support
Manage Volume. Track SLAs. Reduce Escalations.
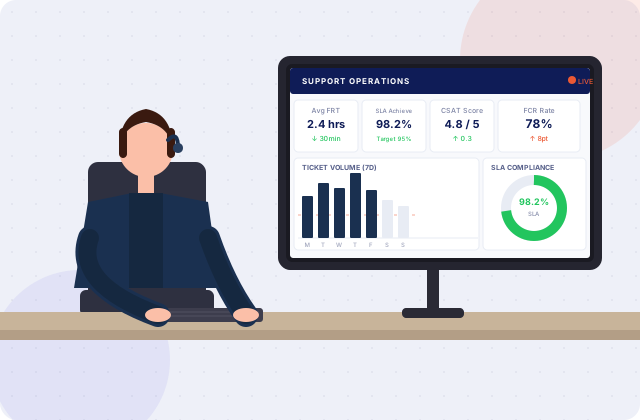
Ticket trends, response times, team performance, and customer satisfaction — in one dashboard. So you manage a support operation, not a reactive firefight.
The Problem
The Support Operations Data Problem
Support teams generate enormous operational data — ticket volumes, resolution times, escalation rates, CSAT scores — but most leaders can't see it in a unified view until it's already a crisis.
01
SLA Breaches Discovered After They've Happened
You find out about SLA misses in the monthly report or when a customer escalates. Real-time visibility would have allowed an intervention before the breach, not a post-mortem after.
02
Team Performance Without Data
You know who your best agents are by feel. You don't have the data to run a meaningful performance conversation, calibrate team targets, or identify who needs coaching.
03
Volume Spikes Without Warning
Ticket surges — after product releases, billing cycles, or service incidents — arrive without warning. Staffing decisions are reactive rather than planned.
What You Get
What Firehawk Gives a Support Leader
Live visibility into your support operation — so you manage proactively and your team performs consistently.
Ticket volume and trend tracking
Daily, weekly, and monthly ticket volumes by category, channel, and product. Spot patterns before they become spikes.
SLA compliance in real time
First response time, resolution time, and SLA achievement tracked live — not in a weekly report. Alert when you're approaching a breach, not after.
Agent performance dashboards
Tickets handled, resolution time, CSAT score, and escalation rate per agent. Data-backed performance conversations instead of gut-feel reviews.
Escalation and repeat contact analysis
Which ticket categories produce escalations? Which customers contact support repeatedly? Root cause visibility that drives resolution improvements.
Customer satisfaction trend
CSAT and NPS trend over time, by category and agent. The leading indicator for churn risk and the metric that connects support performance to revenue retention.
Staffing demand forecasting
Ticket volume patterns by day and hour, connected to team capacity. Justify headcount changes with data instead of intuition.
Your Metrics
The KPIs That Run a High-Performance Support Team
From first response time to CSAT to escalation rate — the metrics that separate reactive support from proactive service.
SLAQualityVolumeTeam
01SLA
First Response Time (FRT)
Average time from ticket submission to first agent response. The most visible SLA metric and the first one customers notice when it's missed.
02SLA
Resolution Time (MTTR)
Mean time to resolution. Tracks team efficiency and complexity — rising MTTR often signals a knowledge gap or process bottleneck.
03SLA
SLA Achievement Rate
Percentage of tickets resolved within contracted SLA. Must be tracked by tier and category, not just in aggregate.
04Quality
Customer Satisfaction Score (CSAT)
Average satisfaction rating from post-ticket surveys. The primary quality metric — and the leading indicator for churn in subscription businesses.
05Quality
Escalation Rate
Percentage of tickets escalated to a higher tier or management. High escalation indicates complexity, knowledge gaps, or agent confidence issues.
06Quality
First Contact Resolution Rate (FCR)
Percentage of issues resolved without a follow-up contact. The efficiency and quality metric — high FCR means lower volume and higher satisfaction.
07Volume
Ticket Volume by Category
Distribution of tickets by issue type, product, or channel. Reveals which areas generate the most support burden and where product or process improvements will have the most impact.
08Team
Agent Handle Rate (Tickets/Day)
Average tickets handled per agent per day. Tracks team productivity and capacity, and connects staffing levels to volume demands.
09Volume
Repeat Contact Rate
Percentage of customers contacting support more than once for the same issue. High repeat contact is a sign of unresolved root causes.
What Others in Your Role Say
Trusted by decision-makers who demand real numbers.
These aren't proof-of-concept pilots. They're operators like you who switched from spreadsheets and other tools to Firehawk — and didn't look back.
48hr
to first dashboard
500+
pre-built KPIs
100%
IP owned by you
“We had no visibility into whether we were meeting our SLAs until the weekly report arrived. By then it was too late to do anything about it. Firehawk gives us real-time SLA tracking and we've reduced SLA breaches by 60% in three months — simply because we can now see them coming.”
O.P.
Head of Customer Support, SaaS Company, NSW
The Process
Support Operations Visibility in 48 Hours
We connect your helpdesk, CRM, and operational systems and deliver a live support operations dashboard — SLA tracking, agent performance, and volume trend analysis — in 48 hours.
01
Day 0
Audit
We review your helpdesk system, SLA definitions, and the performance questions you need answered.
02
Day 0–1
Connect
Connect your helpdesk (Zendesk, Freshdesk, HubSpot Service, Intercom, etc.) and CRM. Automated daily sync.
03
Day 1
Configure
SLA compliance dashboard, agent performance views, volume trends, and CSAT tracking — built for your team.
04
Day 2
Live
Support operations live on Firehawk. Proactive management from day two.
FAQ
Questions answered
Everything you need to know before booking your Blueprint session.
Still unsure?
Talk to the team
Book a 30-minute call and we’ll answer any questions specific to your business.
Firehawk connects to Zendesk, Freshdesk, HubSpot Service Hub, Intercom, Salesforce Service Cloud, and other major helpdesk platforms. Custom integrations are available for proprietary systems.
Ready to see what your data can do?
◆ Infrastructure Studio
Scoped to your business