By Persona — CFO & Finance Teams
Replace Spreadsheet Chaos With Real-Time Clarity.
One source of truth across every entity, every cost centre, and every revenue stream — so your finance team spends time on analysis, not data wrangling.
The Problem
The CFO Data Problem
Finance teams are the most data-intensive function in the business — and often the ones most stuck in spreadsheets. That's not a skill problem. It's an infrastructure problem.
01
Month-End Close Still Takes a Week
Data pulled from multiple systems, reconciled in spreadsheets, formatted into reports, reviewed, revised, and re-sent. Every month. The same process. The same errors.
02
Budget Variance Discovered in Arrears
By the time you know a cost centre is over-budget, it's already happened. Real-time variance tracking means you intervene in the month, not the quarter.
03
P&L by Entity Requires a Full Build
Multi-entity businesses need P&L by entity, by department, and consolidated — usually from three different accounting systems that don't talk to each other.
What You Get
What Firehawk Gives a Finance Team
Automation of the data work so your team can focus on what they were hired to do: interpret, advise, and control.
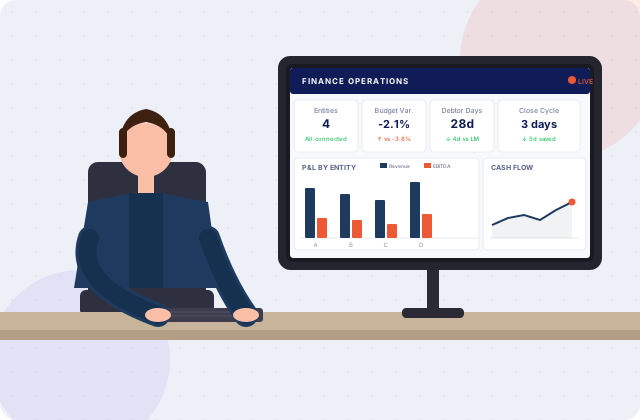
Live P&L across all entities
Multi-entity consolidation with drill-down per entity, cost centre, and revenue line. No manual consolidation. No version conflicts.
Budget vs actuals — every day
Real-time variance tracking at every level of the P&L. You see over-runs when they start, not when they've compounded.
Cash flow visibility without a manual model
Rolling cash position, debtor days, payable days, and working capital trends — updated daily from your accounting system.
Automated management reporting
Management accounts produced from live data. The month-end close becomes a verification exercise, not a build.
Finance team productivity dashboard
Track report turnaround time, data accuracy, and deliverable completion across the finance function.
Scenario modelling from real baselines
Build forecasts from actual data, not spreadsheet assumptions. Scenarios anchored to what the business is actually doing.
Your Metrics
The Finance KPIs That Matter
The metrics that tell you if the business is financially healthy, where cash is at risk, and whether the budget is holding.
P&LCashEfficiencyControl
01P&L
Revenue vs Budget (MoM)
Actual versus plan at the revenue line — by entity, division, and consolidated. The first number every CFO checks.
02P&L
Gross Margin by Entity
Revenue minus direct costs per entity. Identifies which businesses are performing and which are subsidised.
03P&L
Operating Expense Ratio
OpEx as a percentage of revenue. Tracks structural cost efficiency and signals headcount or procurement over-runs.
04Cash
Debtor Days (DSO)
Average days from invoice to payment. High DSO consumes working capital even in profitable businesses.
05Cash
Creditor Days (DPO)
Average days from bill receipt to payment. Optimising DPO within supplier terms is a free source of working capital.
06Cash
Cash Conversion Cycle
Days to convert resource investments into cash flows — combines DSO, DPO, and inventory days. The master working capital metric.
07Control
Budget Variance by Cost Centre
Actual vs budget at cost centre level. Pinpoints where spend is running over and triggers early-stage intervention.
08Control
Intercompany Reconciliation Status
Multi-entity intercompany balance reconciliation status. Eliminates month-end surprises from unreconciled transactions.
09Efficiency
Month-End Close Cycle Time
Days from period end to published management accounts. Tracking and reducing this is a core finance team performance metric.
What Others in Your Role Say
Trusted by decision-makers who demand real numbers.
These aren't proof-of-concept pilots. They're operators like you who switched from spreadsheets and other tools to Firehawk — and didn't look back.
48hr
to first dashboard
500+
pre-built KPIs
100%
IP owned by you
“Our month-end close was 8 days. After Firehawk, it's 3. We eliminated the manual data pulls from four different systems and the spreadsheet reconciliation process that consumed the first week of every month. The team now has time to actually analyse the numbers.”
K.M.
CFO, National Services Group, NSW
The Process
Finance Clarity in 48 Hours
We connect your accounting systems, configure your reporting hierarchy, and deliver your finance team's first live dashboard — in 48 hours.
01
Day 0
Map
We understand your entity structure, chart of accounts, and reporting requirements. Takes an hour.
02
Day 0–1
Connect
Connect your accounting platforms (Xero, MYOB, Sage, NetSuite) and operational systems. Automated data validation included.
03
Day 1
Configure
P&L by entity, budget vs actuals, cash flow dashboard, and management reporting templates — built for your structure.
04
Day 2
Live
Finance team goes live. Management accounts automated. Month-end close compressed. You own the IP.
FAQ
Questions answered
Everything you need to know before booking your Blueprint session.
Still unsure?
Talk to the team
Book a 30-minute call and we’ll answer any questions specific to your business.
Firehawk connects to Xero, MYOB, Sage, QuickBooks, NetSuite, and most enterprise ERP systems. Multi-entity businesses with different platforms per entity are fully supported — all entities consolidated in one view.
Ready to see what your data can do?
◆ Infrastructure Studio
Scoped to your business