By Persona — Board & Directors
Make Strategy Calls With Confidence.
Board-ready reporting. Real numbers. No sanitised summaries. You shouldn't have to wait for a management pack to know how the business is actually performing.
The Problem
The Board Data Problem
Most boards govern with data that is weeks old, manually prepared, and filtered through management's interpretation. That's not oversight — it's wishful thinking.
01
Data Three Weeks Old by the Time You See It
Board packs arrive in the week before the meeting. The financials are from three weeks ago. Decisions made on stale data are decisions made half-blind.
02
Management Summary vs Reality
Management prepares the board pack. By the time it reaches you, it's been curated. You're seeing the version of performance that management wants you to see — not the raw truth.
03
No Independent View of KPIs
You're given the KPIs management chooses to present. Independent verification requires either trust or a data team — most boards have neither.
What You Get
What Firehawk Gives a Board Director
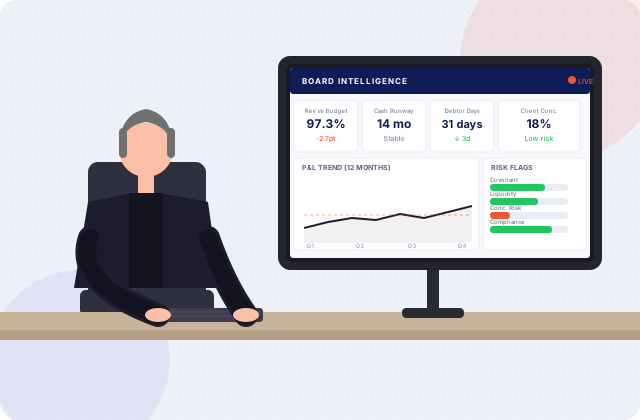
An independent, always-current view of business performance. So every board meeting starts from the same place: facts.
Live P&L — not last month's summary
Revenue, gross profit, EBITDA, and cost ratios updated daily. You can verify management's reports against the live data before the meeting starts.
KPI dashboard with no intermediary
Direct access to the business's performance data. No filter. No curation. The same numbers management sees — or should be seeing.
Variance alerts before they become surprises
Automated flags when performance deviates from budget or prior period. You know before the board pack arrives.
Multi-entity consolidation
If you sit on multiple boards or oversee a group structure, Firehawk consolidates all entities in a single view with drill-down per entity.
Board pack automation
Management produces the board pack from Firehawk. You verify it against the live dashboard. Governance that works both ways.
Role-based access
Each board member sees what's appropriate to their role. Executive directors see operational data. Independent directors see financial performance and risk metrics.
Your Metrics
The KPIs a Board Director Should Be Watching
Not operational minutiae — the strategic indicators that tell you whether the business is on track, at risk, or hiding something.
FinancialRiskStrategicGovernance
01Financial
Revenue vs Budget (Quarterly)
Quarterly revenue performance against board-approved plan. The foundational accountability metric.
02Financial
Gross & Net Profit Margin Trend
Margin trajectory over 12 months. Identifies structural profitability improvement or compression before it appears in annual accounts.
03Risk
Cash Runway
Months of operation possible at current burn rate. The risk metric that determines whether urgent action is required.
04Risk
Debtor Days
Average collection period. High debtor days create cash flow risk even in profitable businesses.
05Risk
Customer Concentration Risk
Revenue percentage from top 3 clients. Concentration above 40% in a single client represents unpriced counterparty risk.
06Strategic
Headcount Growth vs Revenue Growth
Tracks whether the business is hiring ahead of or behind revenue. Reveals leverage or over-investment in people.
07Governance
Strategic Initiative Progress
Milestones and KPIs tied to board-approved strategic initiatives. Separates ambition from execution.
08Governance
Compliance & Regulatory Status
Outstanding compliance items, audit status, and regulatory obligations. Governance visibility without waiting for a management summary.
What Others in Your Role Say
Trusted by decision-makers who demand real numbers.
These aren't proof-of-concept pilots. They're operators like you who switched from spreadsheets and other tools to Firehawk — and didn't look back.
48hr
to first dashboard
500+
pre-built KPIs
100%
IP owned by you
“As a non-executive director, I'd always relied on management to tell me how the business was performing. Firehawk gave me an independent view for the first time. The first board meeting after we went live, I arrived with three questions management hadn't anticipated — because I'd seen the data they hadn't highlighted.”
R.F.
Non-Executive Director, ASX-Listed Company
The Process
Board-Level Intelligence in 48 Hours
We set up board-specific dashboards and access controls — so directors see what they need, management retains appropriate privacy, and governance works as it should.
01
Day 0
Structure
We map the board's governance needs — what to see, what to verify, what to escalate. Takes thirty minutes.
02
Day 0–1
Connect
Connect the business's financial, operational, and CRM data sources. Configure the reporting hierarchy.
03
Day 1
Configure
Board-level dashboards built with role-based access. Directors see strategic KPIs. Management sees operational detail.
04
Day 2
Live
Independent board visibility from day two. No intermediary. No curated summaries. Just the data.
FAQ
Questions answered
Everything you need to know before booking your Blueprint session.
Still unsure?
Talk to the team
Book a 30-minute call and we’ll answer any questions specific to your business.
Yes. Firehawk supports role-based access controls. Board directors see financial, strategic, and risk KPIs relevant to their governance role. Operational detail can be restricted to management. Each access level is configured during setup.
Ready to see what your data can do?
◆ Infrastructure Studio
Scoped to your business